Take your reporting to the next level.
Monitor the development of your performance with interactive charts. I visualize your data in state-of-the-art reports and dashboards.
Demo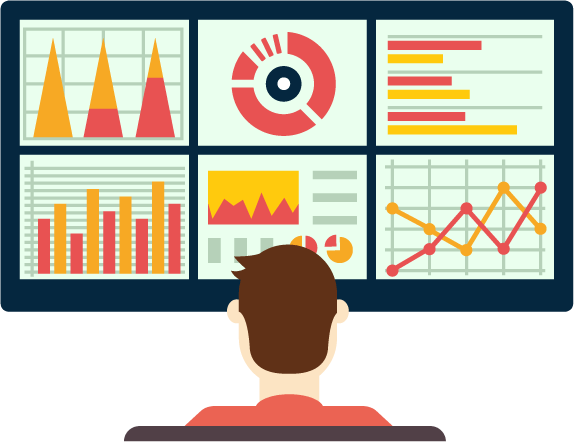
Web reporting
Simply check your data via the browser and track your KPIs in your personal dashboard.
show example
Excel spreadsheets
Export larger amounts of data to Excel tables or display the most important analysis results directly.
show example
Professional design
Receive personalized responsive charts in your reports via PDF files.
show example
Scheduling
Always stay up to date. Have regular updates sent to you via scheduled emails.
-

I know the Jedox software. Creation of data cubes, automated data loading and subsequent reporting solution.
-
Over 10 years of experience in dealing with SAP Business Objects. One of the leading business intelligence solutions (BI) for creating professional reports.
-
Matplotlib is a Python library for the so-called "plotting" of data. Large amounts of data are visually displayed using data science.
-
The Python framework used by companies such as Pinterest, Mozilla and Instagram is ideal for web reporting. With django your data is available everywhere and on all devices.
Want to work with me?
Cool! Let’s talk about your project